As we continue our midyear outlook for 2024, this week we are taking a deeper look at stocks.
Economic Growth Surprised in the First Half
Much of the strong first half for stocks can be explained by the economy’s resilience. As 2023 ended, recession risk was elevated, and the economy appeared to have little cushion if conditions deteriorated. Now, with the benefit of hindsight, we know the economy enjoyed plenty of cushion — cushion that it hasn’t needed. Stocks were not pricing in enough economic or profit growth. Now that the bar has been raised, what will stocks do for an encore?
Gauging Upside Using Historical Market Patterns
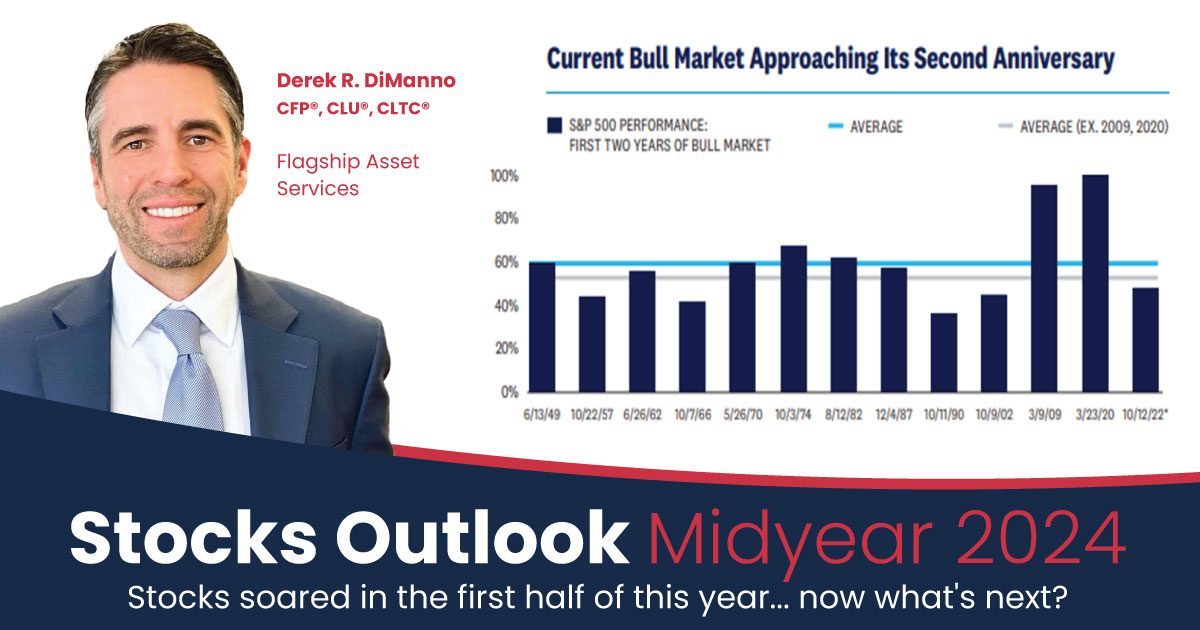
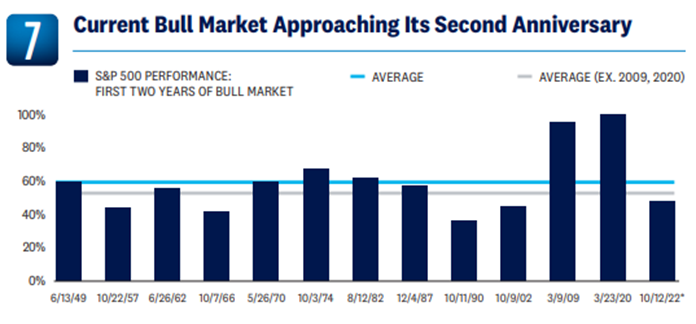
Markets tend to move in cycles, as we discussed in Outlook 2024: A Turning Point, so we can use historical patterns to help form an opinion about where stocks might go in the second half of the year. We regularly say history doesn’t always repeat, but it often rhymes. Let’s start with basic market cycles. The S&P 500 has gained 52.8% during the current bull market that began on October 12, 2022. That may sound like a lot, but it is actually short of the historical average gain for a two-year-old bull market at 60%. It’s right in line with the average if we exclude sharp rallies from the 2009 and 2020 lows (53%). Based solely on this analysis, stocks may not be able to deliver much additional upside in the second half of the year, although rising corporate profits and the growing trend in stock buybacks could enhance the backdrop for stocks.
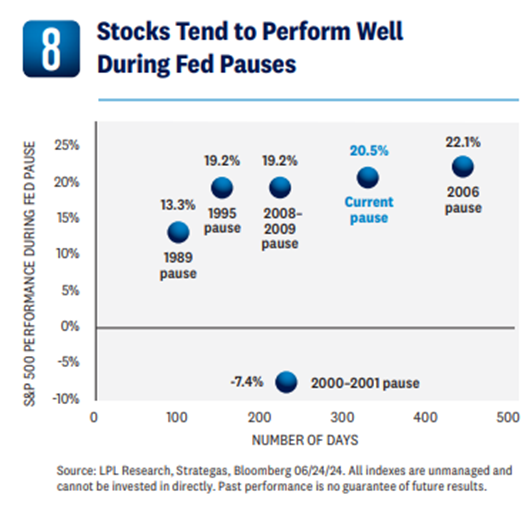
For additional perspective on where stocks may be headed, we can use the monetary policy cycle. The Fed is currently in a pause, defined by the time period between the last rate hike of a cycle and the first rate cut of the next cycle. The current Fed pause, at 331 days, is the second-longest in modern market history, trailing only 2006–07 (446 days), while the average of the six pauses since 1989 — has spanned 248 days.
The S&P 500 has risen during five of these six pauses, with an average gain of 14.5%. The 2000–01 pause was the only one where stocks fell — the S&P 500 lost 7% during that pause, which was marred by recession and accounting scandals. Since the current pause began, after the Fed last raised rates on July 26, 2023, the S&P 500 has gained 20.5%. Contrary to the above scenario, if this monetary cycle is comparable to those in the past – and we generally think it is — then stocks may struggle to add much, if any, to first-half gains over the next several months.
Volatility is Normal
Volatility is another familiar market pattern. Just because you may think this bull market keeps running doesn’t mean the move higher will be steady. On average, in a given year, the S&P 500 Index experiences three pullbacks (5-10%) and one 10-20% correction. The average maximum drawdown in a positive year, which 2024 will likely be, is 11%. So far in 2024, the maximum drawdown for the index has been just 5.5%, suggesting more volatility may be coming. During a presidential election year, increased volatility in September and October is common. A geopolitical shock or an unexpected reacceleration in inflation that puts rate hikes from the Fed back on the table also carries the potential to bring volatility.
Earnings Doing their Part
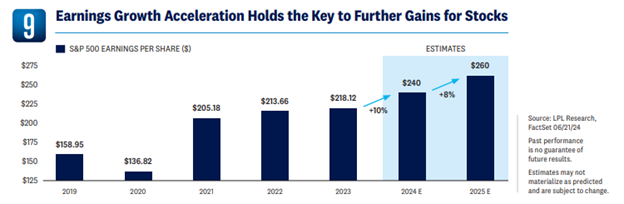
Last December, corporate America had just emerged from an earnings recession. Now six months later, despite sizable drags from healthcare and natural resources, earnings growth is accelerating and approaching double-digits. With valuations elevated, earnings must hold up, and they have been doing their part.
Solid economic growth, supply chain normalization, effective cost control, and investment in artificial intelligence (AI) have helped fuel the strong rebound in earnings this year. In response to improved corporate profit trends, LPL Research is raising its S&P 500 earnings per share (EPS) forecasts for 2024 and 2025 to $240 and $260, from $235 and $250, representing growth of 10% and 8%. That may seem optimistic, but it’s near long-term averages. Some reversal of recent declines in healthcare and natural resource sector profits will help support earnings in the second half, along with additional investment in AI, and continued effective cost controls. The impressive and unusual resilience of analysts’ earnings estimates this year is also encouraging.
Valuations May Limit Second Half Gains
In attempting the difficult job of predicting where the stock market might go, assessing how much good news has already been reflected in stock prices is important. At a price-to-earnings ratio (P/E) of around 21 based on the consensus earnings per share (EPS) estimate for the S&P 500 over the next 12 months, stocks seem expensive, and a lot of good news is already priced in. Factoring interest rates into the valuation picture, the story is not much different. Comparing yields from fixed income to earnings from stocks, investors are being minimally compensated for taking on equity risk relative to Treasury yields (though we expect Treasury yields to fall further as inflation comes down). In other words, forecasting anything better than modest upside in equities requires relaxing any valuation discipline, a practice in which we do not engage.
One caveat to consider is valuations statistically have very little predictive power over short time periods of a year or less. That means as long as earnings come through, as they did in late April and May, stock market pullbacks are likely to be bought despite rich valuations.
Year-End S&P 500 Target Range
An expected, further easing in inflation, stable if not lower interest rates, and a steady earnings trajectory support an above-average target on paper. Based on the current price-to-earnings (P/E) ratio of 21 times, and our projected 2025 S&P 500 earnings per share (EPS) of $260, an estimated fair-value range for the S&P 500 at the end of 2024 would be between 5,400 and 5,500, near late-June levels. However, this doesn’t take into account volatility. Given the heightened geopolitical situation, the upcoming U.S. presidential election, and other idiosyncratic structural factors, we expect market volatility to rise in the second half of the year, and potentially sharply at times. Factoring this into our view, a higher forecast is not justified at this time and our year-end target range for the S&P 500 remains 4,850 to 4,950. As such, waiting for a dip to buy looks to be an appropriate strategy for those looking to add equity exposure.
If AI proves to be a stronger and timelier productivity enhancer than anticipated, volatility fails to materialize, and inflation and interest rates cooperate, there could be an upside to both our earnings forecast and target assumptions.
The Bottom Line:
Stocks soared in the first half of 2024, thanks to a surprisingly resilient economy and the anticipation of looser policy from the Fed. Meanwhile, the AI-fueled technology rally certainly gave the major indexes a boost. However, a lot of the good news may already be priced in. Valuations are high, and future equity market gains will rely heavily on earnings growth continuing to positively surprise against a backdrop of much loftier expectations.
While incremental gains are certainly possible in the second half, volatility is likely to pick up. Investors should be prepared for potential setbacks, especially considering the upcoming presidential election and the heightened geopolitical situation. As such, our year-end target range for the S&P 500 remains 4,850 to 4,950. For those looking to add to equity exposure, chasing should be avoided and a buy-on-dips approach is favored.